

水稻暴露于镉后与基因表达相关的DNA甲基化模式的变化
发布日期:2019-03-19 浏览次数:2811
摘要:
本文报道了全基因组单碱基分辨率下,镉胁迫水稻的甲基化的胞嘧啶和转录组的变化。在镉胁迫和无镉水稻基因组之间,CG和非CG的甲基化标记有广泛差异。检测到2320个非冗余的差异甲基化区域。RNA测序发现了2092个DNA甲基化修饰基因在镉胁迫下的差异表达。上游、下游、基因区,高甲基化(CG,CHH,CHG)的基因比低甲基化的基因更多。许多基因与应激反应、金属转运和转录因子有关。大多数的DNA甲基化修饰基因在镉胁迫下发生转录改变。在DNA甲基化和组蛋白修饰活性中的一个功能缺失的突变体子集,被用来确定选定的基因的转录丰度。相比于野生型,DRM2和MET1的突变导致镉胁迫后基因较低的转录水平,DRM2中OsIRO2、OsPR1b和Os09g02214的转录本明显减少。一种常用的DNA甲基化抑制剂,5-氮杂胞苷,被用来探讨DNA去甲基化是否产生生理后果。5-氮杂胞苷降低所选基因的DNA甲基化水平,但促进水稻幼苗生长和水稻镉积累。
材料:水稻(Oryza sativa ssp japonica cv. Nipponbare)
取材方法:种子用5%次氯酸钠消毒,用蒸馏水彻底清洗。30℃、暗室孵育两天,种子萌发。随后,幼苗被转移至1.2L聚乙烯容器中,加入一半霍格兰营养液,暗室孵育两天。然后,又在14h光照(30℃)、10h黑暗(25℃)下,孵育两天。之后,进行0μM和 80μM的镉(硫酸镉)处理,pH 5.8,设三个生物学重复。对BS-seq和RNA-seq,80μM的镉(硫酸镉)处理四天。对长期实验,0μM和 5μM的镉处理一个月。
DNA提取:每个文库36个苗。QIAamp DNA Mini Kit。
RNA提取:每个文库36个苗。TRIzol Reagent。共四个库(根、茎有无镉)。
测序:BS-seq(重亚硫酸盐测序):Illumina hiseq 2500。两个库(幼苗有无镉)。原始reads:220M(无镉)、213M(有镉),平均测序深度:27.7X、25.99X。
RNA-seq:Illumina hiseq 2500,PE。
分析:
BS-seq数据比对:SOAP 2.21
RNS-seq数据比对:bowtie2,eXpress
统计分析:最小显著性差异(LSD)、SPSS 12.0
研究结果:
1、0μM和 80μM的镉处理4天,差异的CG和非CG甲基化位点。
A、B、5号染色体上甲基化密度分布。蓝色点:密度。线:CG、CHG、CHH。
C、水稻各染色体甲基化水平。
D、E、基因组各区域甲基化分布(镉处理的低于对照)。n-甲基化位点数,红色:甲基化水平(由浅到深);蓝色:CpG的密度分布。
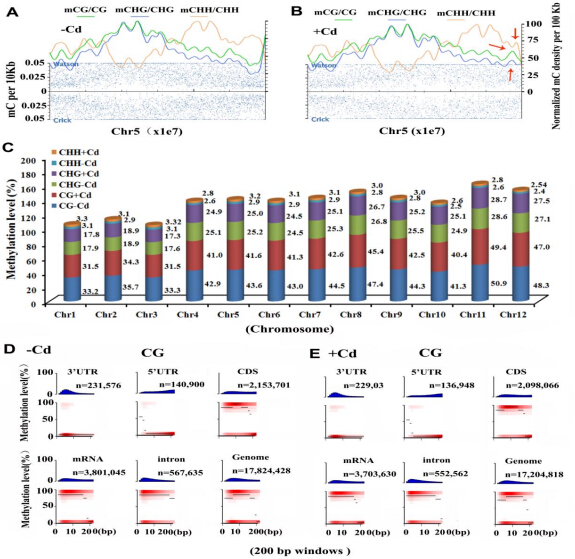
Figure 1. Differential CG and non-CG methylation levels in genomic regions of two days-old rice exposed to 0 (-Cd) or 80 μM Cd (+Cd) for 4 d. A single-base DNA methylation BS-Seq of the two lines was performed (M&M). (A and B): The density profiling of methylcytosines in chromosome 5. Blue dots indicate methylcytosine density. Smoothed lines represent the methylcytosine (CG、CHG and CHH ) density in each context. Red arrows highlight the differences of methylcytosine density between the Cd-free and Cd-exposed rice chromosome 5. (C): Levels of CG methylation and non-CG methylation in rice chromosomes. (D, E): The heatmap of genomic regional distribution (3-UTR, 5-UTR, CDS, intron and mRNA) characteristics. n represents the number of methylcytosines. The x axis indicates the number of methylcytosines in 200 bp windows that display each mean methylation level (y axis). The black line represents the methylated median value in specific density of CpG. Red zone reflects the particular methylation level from shallow to deep and the number of methylcytosines. The above blue bar chart represents the density distribution of CpG and mapping to the horizontal axis.
2、DMR相关的基因分析和GO富集。
A、不同的基因组区域(上游最多、基因区最少、下游)的DMR基因。
B、GO富集分析(红色上调、绿色下调)
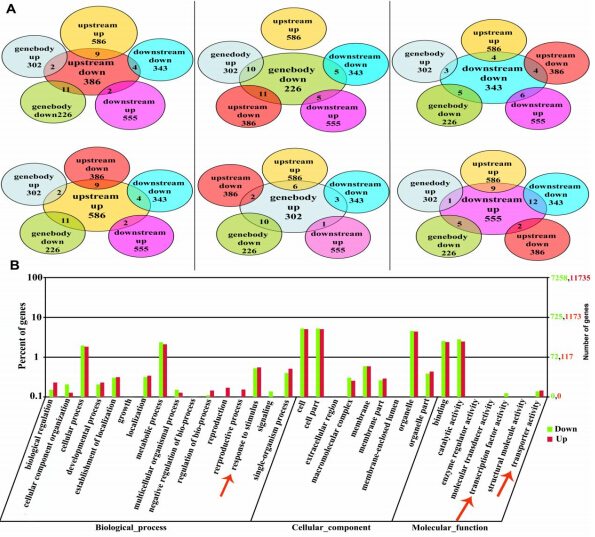
Figure 2. Analysis of DMR-associated genes and gene ontology (GO) enrichment. DMR genes in different genomic regions (upstream, genebody and downstream). Differential methylation patterns were characterized with the different methylcytosine levels, which was found from less than five windows of CG (CHG and CHH) in the same position of -Cd and +Cd-exposed rice genomes. (A): Venn diagrams display the overlapping for the number of up-methylated or down-methylated genes in different genomic regions including upstream, genebody and downstream. (B): GO clustering analysis of DMR-associated genes based on their functional enrichment. The up-methylated (red) and down-methylated (green) genes were annotated with WEGO (Web Gene Ontology Annotation Plotting). Annotations are grouped by cellular component, molecular function or biological process based on the rice GO annotation information. Two days-old rice seedlings were exposed to 0 or 80 μM Cd for 4 d and the samples were then used for BS-seq and RNA-seq,
3、镉胁迫水稻的转录组分析
A、有无镉处理下差异表达基因(2092个)的热图。
B、有无镉处理下转录本的丰度。黑点为差异基因。镉处理后,更多基因表达被抑制。
C、主成分分析(PCA)结果。根茎有明显差异。
D、FPKM的箱线图。
E、根和茎有无镉处理的水稻转录组KEGG富集分析。
F、G、根茎qRT-PCR实验验证。最显著上、下调的基因。
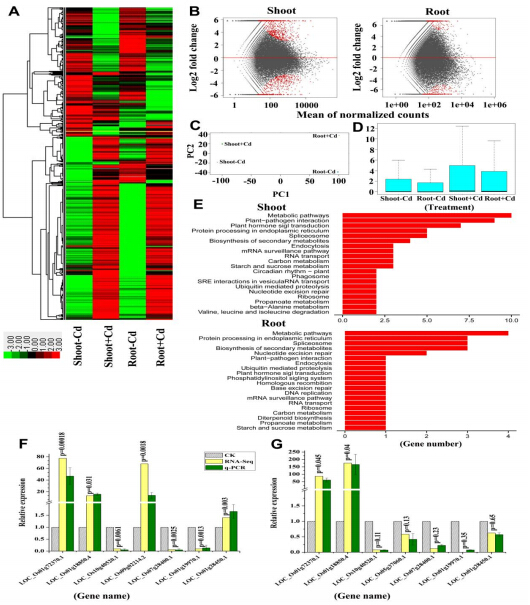
Figure 3. Analysis of Cd-exposed rice transcriptome. (A): Heatmap representation of a one-dimensional hierarchical clustering of differential gene expression as determined by mRNA-seq for the Cd-exposed rice (shoots and roots) relative to the control (Cd-free). (B): Differential transcript abundance of Cd-free and Cd-treated shoots and roots. The y axis represents the log2 fold change under the mean normalized expression of all transcripts (x axis). Black dots indicate the differential genes (p<0.01). (C): Results of principal component analysis (PCA). Samples of shoot and root had visible differences. (D): Box-whisker Plot FPKM (reads per kilobase of transcript per million reads) of four samples (Shoot-Cd, Shoot+Cd, Root-Cd and Root+Cd). (E): KEGG enrichment analysis of Cd-exposed and control rice transcripts in shoot and root. Y-axis represents pathways, while X-axis represents gene number (p<0.05). :="" qrt-pcr="" validated="" eight="" randomly-selected="" cd-responsive="" mrnas="" from="" most="" up-and="" down-regulated="" candidate="" genes="" the="" log2="">2] in shoot (F) and root (G). qRT-PCR results were normalized to the data from Cd-free shoots and roots, respectively. Two days-old rice seedlings were exposed to 0 (-Cd) or 80 μM Cd (+Cd) for 4 d. Vertical bars represent standard deviation (SD) of the mean of three biological replicates (n=36 seedlings). Significance of differences between the treatments was statistically evaluated (p<0.05).
4、联合分析DNA甲基化改变和转录表达水平改变的基因
A、DNA甲基化区域相关的基因(2320)和镉胁迫的差异表达基因(2092)。
B、2092个差异表达基因中DMR基因和非DMR基因的比例。(82个基因既是差异表达基因也是差异甲基化位点)。69.5%的DEGs可能由甲基化修饰。
C、镉处理下,82个基因的功能分级聚类。热图表示甲基化水平。
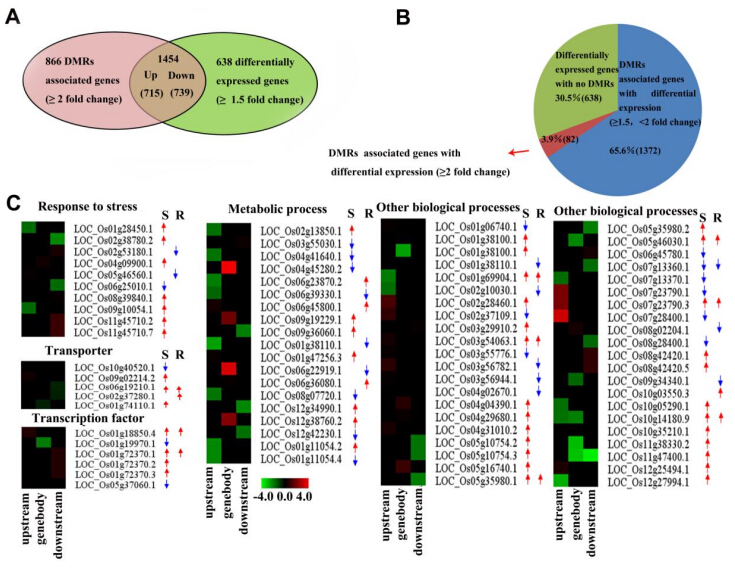
Figure 4. Combinational analyses of genes that changed in DNA methylation and genes that were changed in transcriptional expression. (A): Venn diagrams display the association between DNA methylation region (DMR)-associated genes (≥ 2 fold change, p < 0.05) and Cd-induced differentially expressed genes (≥ 1.5 fold change, p < 0.05). (B): the proportion of DMR genes and non-DMR genes within the 2092 differentially expressed genes. Of these, 82 represents genes differential expression (≥ 2 fold change, p< 0.05) and differential methylation (≥ 2 fold change, p < 0.05). (C): Functionally hierarchical clustering of the 82 genes expressing under Cd stress. Heat map represents the methylation levels of individual Cd-responsive genes. Arrows indicate up or down expression of the gene upstream, genebody and downstream regions of the rice shoots (S) and roots (R). Two days-old rice seedlings were exposed to 0 (-Cd) or 80 μM Cd (+Cd) for 4 d and the samples were used for BS-seq and RNA-seq.
5、举例:分析四个基因的DNA甲基化和基因表达。
A、镉胁迫下四个基因的差异甲基化水平。
B-E、BS-seq分析特定位点的DNA甲基化。
F、镉胁迫下四个基因的表达水平。
G-J、qRT-PCR实验验证,设浓度梯度。Osactin内参,三个生物学重复。
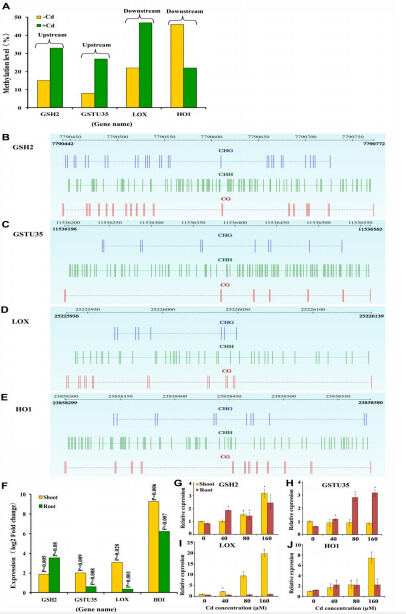
表明,某些基因的DNA甲基化和表达水平都受到镉的影响。
Figure 5. Profiling of DNA methylation and expression of representative genes coding for glutathione S-transferase 2 (GSH2), glutathione S-transferase U35 (GSHU35), lipoxygenase (LOX) and heme oxygenase-1 (HO1). Differences of DNA methylation levels (≥ 2 fold) and patterns of genes under Cd stress (A) and profiling of DNA methylation at specific sites of the genes by BS-seq (B-E). Differential expression of genes in Cd-exposed rice shoots and roots (≥ 2 fold, p< 0.05) was analyzed by RNA-seq and data were presented as the ratio of log2 [FPKM values (μtreated/μuntreated) ] (F). Two days-old rice seedlings were exposed to 80μM Cd for 4 d (A-F). qRT-PCR validation of gene expression in two days-old rice exposed to Cd at 0, 40, 80 and 160 M Cd for 4 d (G-J). Osactin was used as an internal reference gene for normalization. Vertical bars represent standard deviation (SD) of the mean of three biological replicates (n=36 seedlings). Asterisks indicate the significant difference between the Cd treatment and control (Cd-free) (p<0.05).
6、镉胁迫水稻的表观遗传基因的转录水平
DNA甲基转移酶家族成员受镉胁迫的表达水平。ROS1-新发现的去甲基化酶编码基因。RNA依赖型的RNA聚合酶蛋白基因。组蛋白修饰、染色质重塑等。
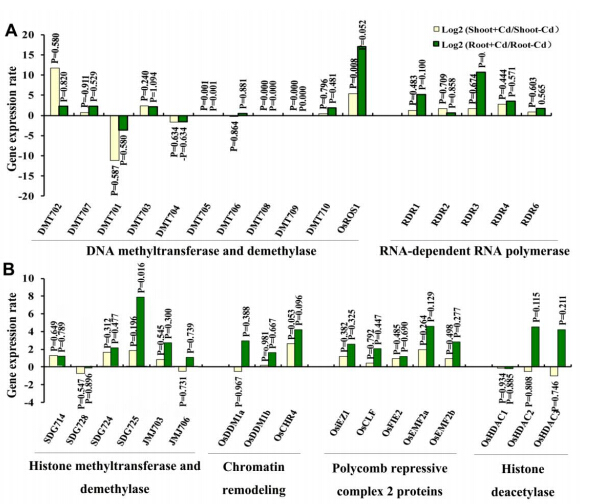
Figure 6. Transcript levels of epigenetic genes in Cd-exposed rice. DNA methylation/demethylation, chromatin modified and other DNA methylation-related genes reported in rice were included. The transcriptional levels of genes differentially induced by Cd exposure were determined by mRNA-Seq. Data are represented as the ratio of log2 [Fragments Per kb per Million reads (FPKM) values (μtreated/μuntreated) ]. Two days-old rice seedlings were exposed to 0 (-Cd) or 80 μM Cd (+Cd) for 4 d and the samples were used for RNA-seq.
7、T-DNA插入鉴定和突变体水稻DNA甲基化活性的转录水平
A、2715的载体插入启动子区、外显子区、内含子区突变位点DNA结构示意图。箭头表示RT-PCR分析突变的引物位置。
B、插入突变体的PCR分析。LP、RP、LB、RB表示突变型和野生型所用引物。
C、RT-PCR、qRT-PCR分析突变体基因。与野生型相比,突变体的基因表达沉默。水稻肌动蛋白和泛素作为内参。
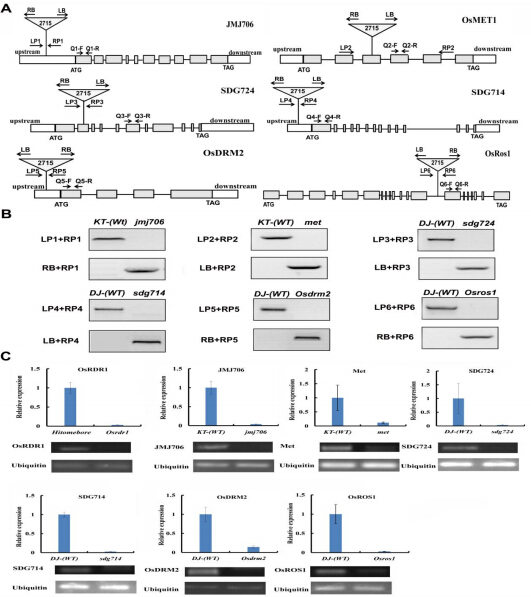
Figure 7. Identification of T-DNA insertion and transcript levels of mutants defective in DNA methylation activities in rice. (A) Schematic diagram of DNA structures of the mutant locus with a 2715 vector insertion into the 1000 bp promoter of JMJ706, SDG714 and OsDRM2, 3rd exon of OsMET1, 2nd exon of SDG724 and 13th intron of OsROS1 (inverted triangle). The coding region and 5’ and 3’ untranslated regions are illustrated by the white boxes. Exons are indicated by grey lines. The locations of the primer pairs used to analyze the mutation by RT-PCR are indicated by the arrows. (B): PCR analysis of the insertion mutants. The genome DNA of mutants and wild-type were PCR-amplified using primer pairs indicated as LP, RP, LB or RB. (C): RT-PCR and qRT-PCR analyses of gene transcripts in the mutants with gene-specific primers. Relative to WT, expression of Osrdr1, jmj706, met1, sdj724, sdj714, Osdrm2 and Osros1 was silenced in rice seedlings, respectively. Six days-old rice seedlings grew under the normal condition. The samples were used for PCR analysis. Rice actin and ubiquitin were used as internal references. Vertical bars represent standard deviation (SD) of the mean of three biological replicates (n=36 seedlings). Asterisks indicate the significant difference between mutants and wide-type (p<0.05).
8、qRT-PCR分析转录本丰度。
分别在wild-types Dong Jing (DJ), Kitaake (KT), Hitomebore (Hit)及突变体下。
A-D、镉胁迫下,野生型中基因转录本表达水平明显高于sdg714、724。
C、一些特定的DNA甲基化的突变导致OsPR1的表达水平改变。
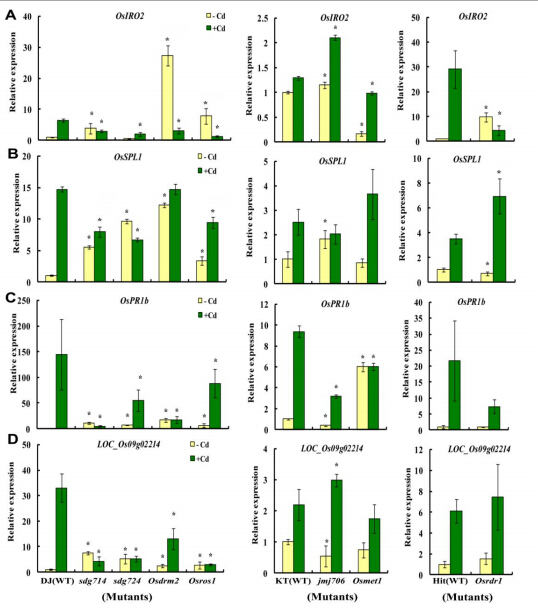
Figure 8. qRT-PCR analysis of transcript abundance of OsIRO2 (A), OsSPL1 (B), OsPRb1 (C), and LOC_Os09g02214 (D) in a set of mutants with null genes relevant to epigenetic modification under Cd exposure. Two days-old seedlings were exposed to 0 (-Cd) or 80 μM Cd (+Cd) for 4 d. The wild-types Dong Jing (DJ), Kitaake (KT) and Hitomebore (Hit) and mutants with their corresponding background were presented. Vertical bars represent standard deviation (SD) of the mean of three biological replicates (n=36 seedlings). Asterisks indicate that the mean values are significantly different between mutants and wide-type (p<0.05).
9、DNA甲基转移酶抑制剂(Aza)促进水稻生长及镉积累
A、幼苗表型;B、幼苗初生根的生长;C、幼苗干重;D、镉含量;
E、DNA甲基化水平(Aza使DNA甲基化水平降低);
F、转录水平(与Cd相比,添加了Aza增加了大多数基因的转录水平)。
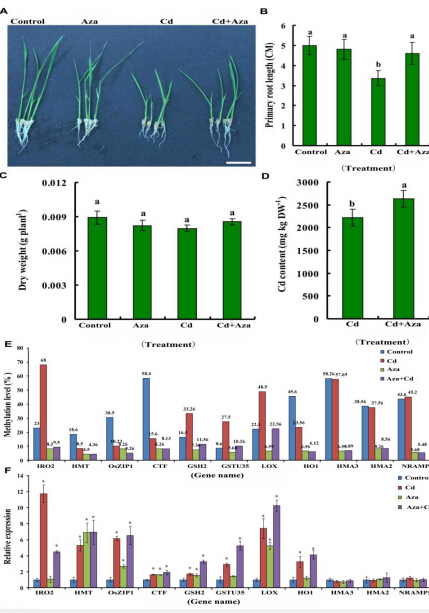
Figure 9. Effects of DNA methyltransferase inhibitor (5-aza-2-deoxycytidine, Aza) on the growth, Cd content, and DNA methylation and transcripts of several genes involved in Cd transport and detoxification in rice seedlings under Cd-free (control) and Cd-exposed conditions. Three days-old rice seedlings were treated with Cd (80 µM) and/or Aza (20 µM) for 3 d. Thereafter, the phenotype of rice seedlings (Scale bar = 2 cm) (A), primary root growth of seedlings (B), dry weight of seedlings (C), Cd accumulation in whole seedlings (D), DNA methylation levels of the genes (E), and transcript levels of the genes (F) were determined. Vertical bars represent standard deviation (SD) of the mean of three biological replicates (n=36-48 seedlings). Data with the different letters or asterisks indicate the significant difference between the treatments (p<0.05).
亮点分析:
1、本研究鉴定了水稻镉胁迫后的差异甲基化位点,结合基因表达水平及功能后果。
2、有镉及无镉水稻基因组中,CG和非CG甲基化位点存在广泛差异。
3、差异甲基化的位点中,发现一组金属转运蛋白的编码基因、Cd解毒蛋白、金属相关的转录因子,可调节水稻耐受镉胁迫。
参考文献:
Variation of DNA methylation patterns associated with gene expression in rice (Oryza sativa) exposed to cadmium.
Plant Cell Environment . 2016, IF= 6.169
- 上一篇:东方粘虫中甲壳素合酶A的鉴定和功能分析
- 下一篇:藜麦基因组de novo测序